Exercise 2: extracting for the same point the elevation
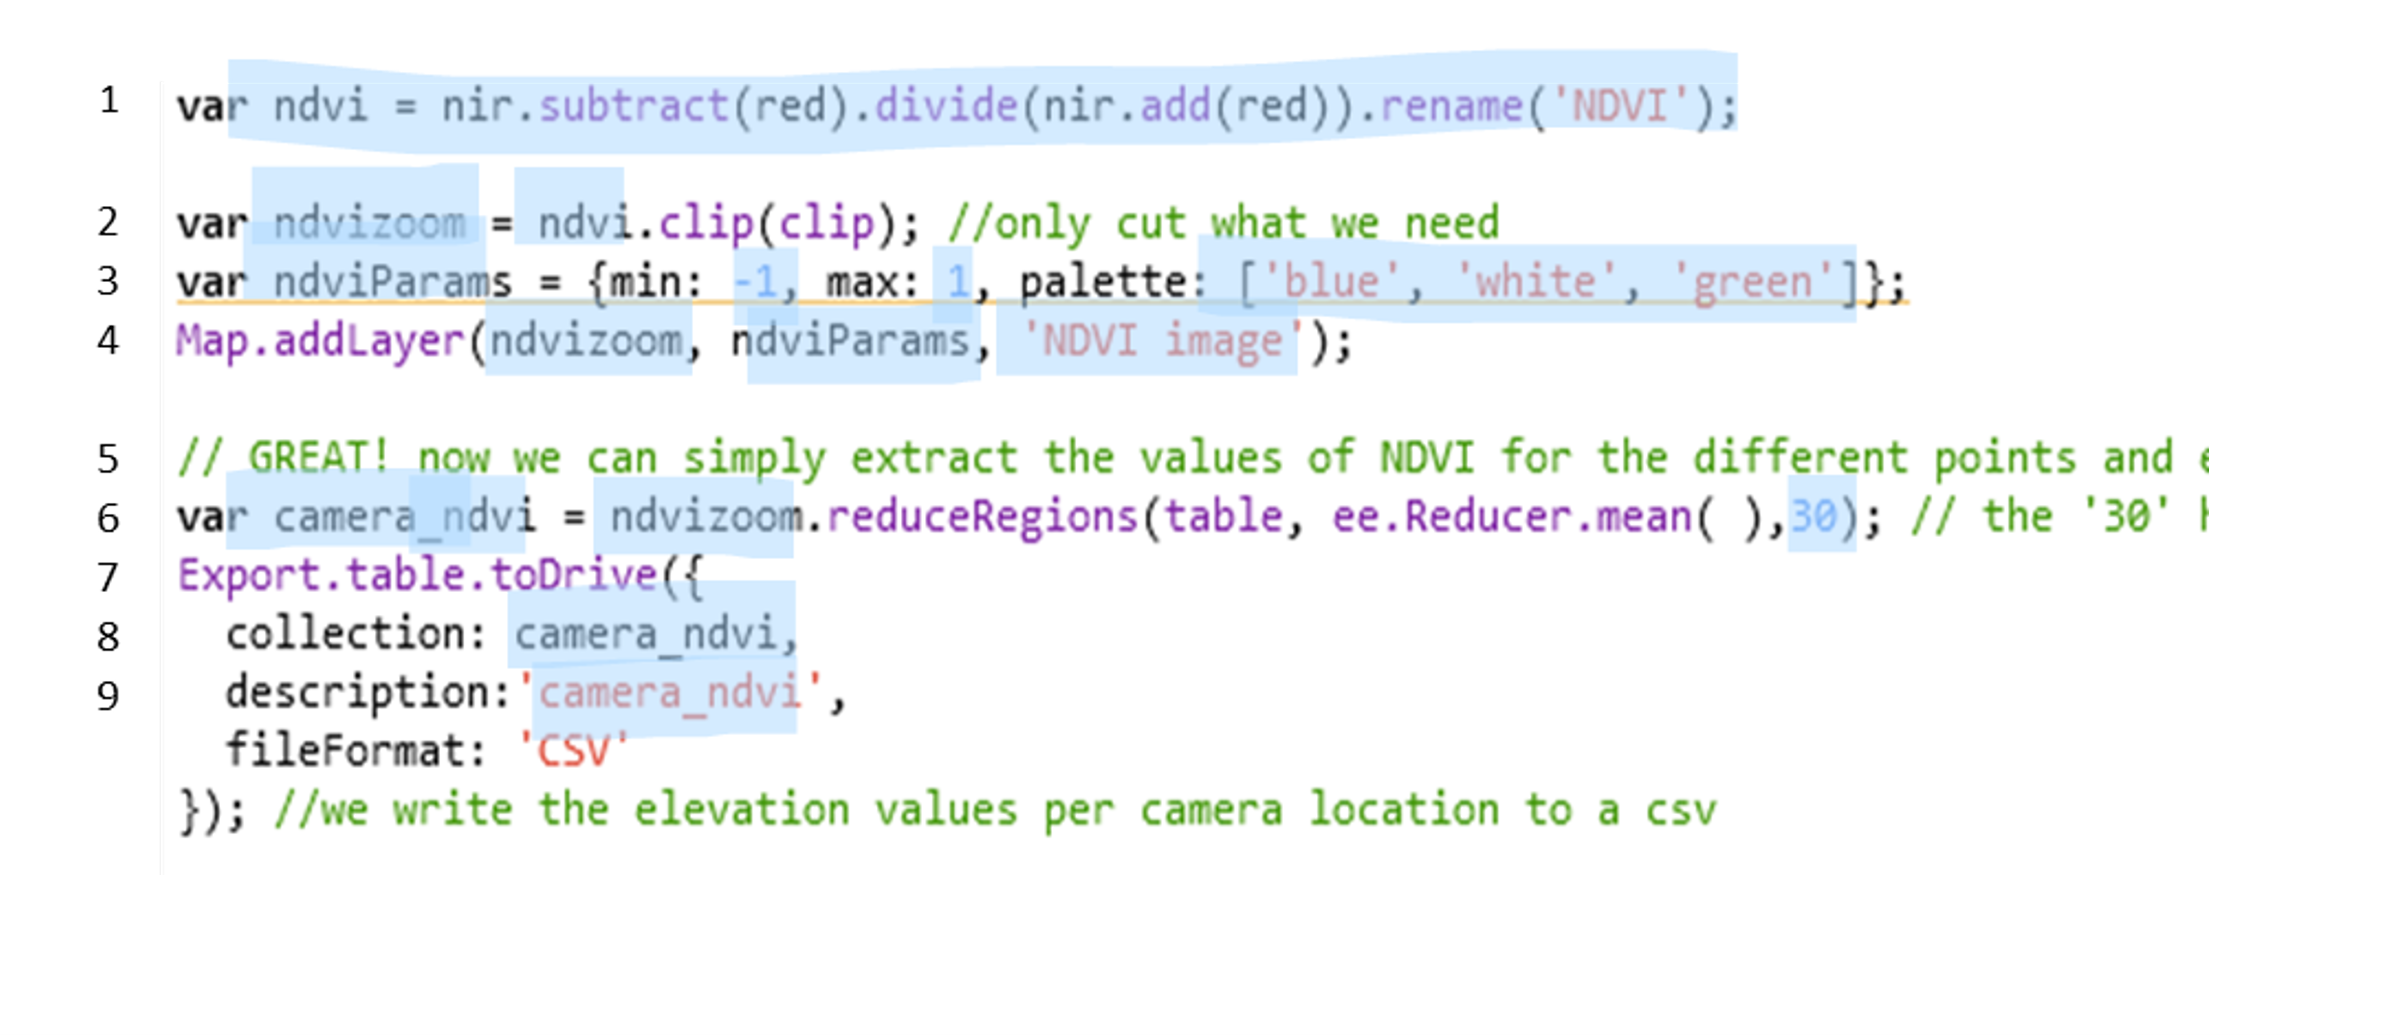
This exercise is very similar to what we have done in the previous exercise (but easier): earlier today, you selected one image from an image collection, and then calculated the ndvi (this is also an image). After that you performed following lines:
Now… in the previous practical, you have learned how to load a DEM (which will be an image). To now extract elevation values for the points, you can use what you have learned today and in the previous course.
If you’re lost, try to follow these steps:
- import the DEM like you have done in the first practical
- adjust the code above, but only the blue parts are necessary to adjust:
- line 1: here you should define the DEM image
- line 2: here you clip the variable you just defined in line 1
- line 3: here you make a variable that is used to visualize the dem later: replace the blue elements to whatever makes sense
- line 4: Map your dem image with the visualization parameter you just made, also give it a new title
- line 6: make a new variable where the elevation values are added to the table of points
- line 7: export this new table, and also change its description
–> If you are stuck, make sure that you check again how you imported/visualized the DEM in the first practical, and that you understand everything you have done previously today.
–> If you cannot find the answers there, feel free to ask.
Once you also have the elevation, export the two tables to your google drive:
You can now find the .csv files in your google drive, and you can download them there.
** Now, let’s try to import this data into Rstudio and build a simple statistical regression to see if species richness is associated with elevation or NDVI