Welcome to the last practical.
Congratulations, you have come a very long way…
In the previous two sessions, we have focessed a lot on implementing command-line based data retrieval and analysis, and tried to move away from a point-and-click approach.
This was not without reason:-).
Command-line-based tools allow repetition, (parallel) processing, automation of algorithms, and automatic data retrieval.
This is often done through an API, or Application Programmin Interface, or a set of conventions/rules/protocols that can be used so that one application (e.g. QGIS) can easily communicate with another (e.g. open street map).
Although the term might be new to you, the concept itself is not.
- e.g. try typing ‘weather Amsterdam’ in Google: google will understand that these two strings mean you want to search for a weather forcast and will use this to construct one based on 3rd party weather providers.
- Actually… the exercises we have done in GEE is a good example of an API implementation: GEE knows and recognizes conventions (e.g. map.AddLayer(), ee.ImageCollection()….) and knows how to use these to perform tasks
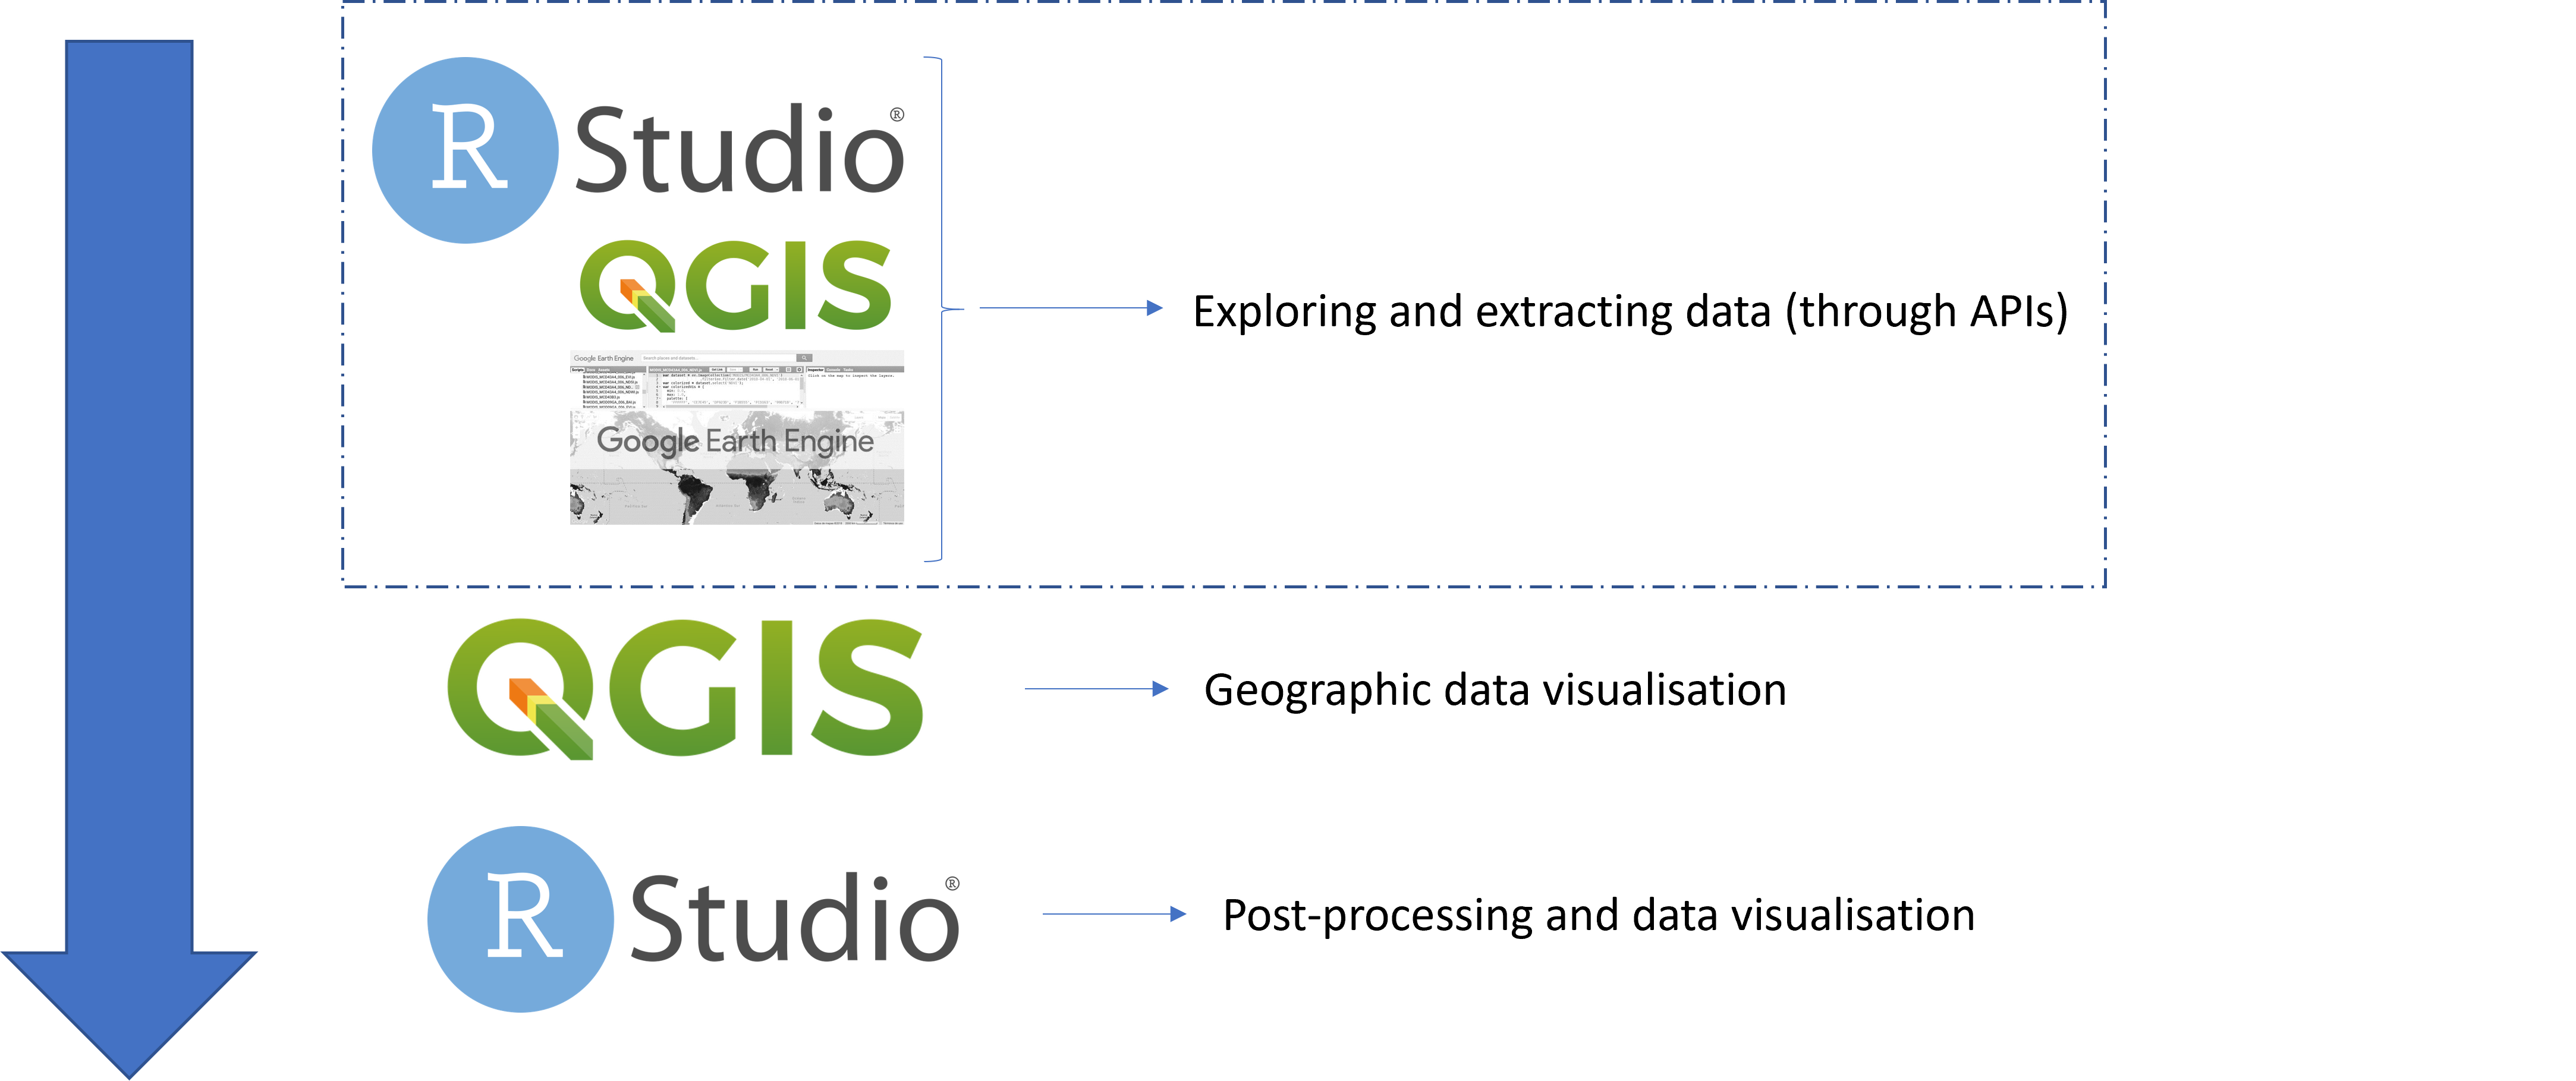
In this last practical we will be using a combination of Google Earth Engine-QGIS-R to analyse the occurrence of Raccoons in Belgium. We will use API implementations in all three tools to access data, and we’ll do a processing step in QGIS and some postprocessing in Rstudio.
Make sure you found your way trough the first practical as well as the second practical as this last practical builds upon this.
The presentation that is used in class to introduce this practical session can be downloaded here
Step 1: The case-study
The case we are investigating today is where the raccoon lives in Belgium. The raccoon is an exotic species, that is not endemic to the area and might pose problems for local species as well as induce nuissance for humans. We are therefore quite interested in where they live currently.
More than only ‘showing’ where they live (on a map) we also want to investigate two spatial factors that might co-determine their spatial pattern of occurrence: the presence of rivers, and the topographic diversity of the landscape.
Problem simplification
Much like all problems, we’ll need to simplify and define this one as well:
| Building block | Decision |
|---|---|
| Geographic scale | Regular cels – small enough to capture relevant habitat changes |
| temporal scale | Raccoon is only recent phenomenon in Belgium, so we focus on occurrences >2015 |
| Assumption | “opportunistic” observations of raccoons by the general public over the past years are of sufficient quality and can be linked to biophysical conditions, Raccoons might (???) habitats with more diversity in topography and/or the presence of water |
| Dimensions | we focus on (i) topographic diversity and (ii) the presence of water |
| Dimension description | Topographic Diversity as calculated from a DEM, and the river network as provided by OSM |
Data description
Now that we have described the problem, we can describe the data we’ll use
| Dataset | Type | Source | Access point |
|---|---|---|---|
| Raccoon sightings | Vector:points | GBIF | GBIF API in R |
| River Network | Vector:lines | Open Street Map | OSM API in QGIS |
| Topographic Diversity | Raster | derived from the ALOS DEM | Google Earth Engine |
| Boundary of Belgium | Vectory: polygon | OSM | Direct download: https://biogeo.ucdavis.edu/data/diva/adm/BEL_adm.zip |
Before we continue, you’ll need one more thing: an account on gbif.org: remember which email address you used, and your password
Now we are ready for the next step: using the various APIs to download the data